
GOVERNMENT, TRUST AND POLITICAL PARTICIPATION
Summarized below are the major findings from section 6 of the Pew Research survey, Trends in Political Values and Core Attitudes: 1987-2007.
Relative to the public’s satisfaction with their government, the survey stated, “While public satisfaction with government and elected officials has ebbed and flowed over the past two decades, the current trend is one of growing frustration and criticism. A good deal of this dissatisfaction comes from Democrats, whose views largely reflect their judgments of the current administration. By comparison, in the mid-1990s Republicans were considerably more critical of government and politicians than were Democrats.”
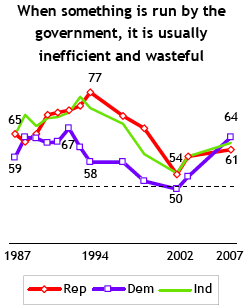
It’s inefficient and wasteful
| Agreement | 1994 | 2002 | 2007 |
|---|---|---|---|
| Agree | 69% | 53% | 62% |
| Disagree | 30% | 43% | 34% |
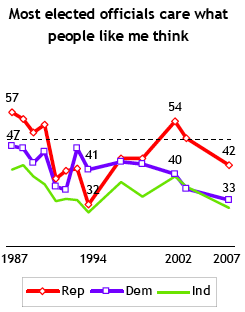
What I think …
| Agreement | 1994 | 2002 | 2007 |
|---|---|---|---|
| Agree | 33% | 44% | 34% |
| Disagree | 66% | 52% | 62% |
Notice how the Democrats
have taken the lead.
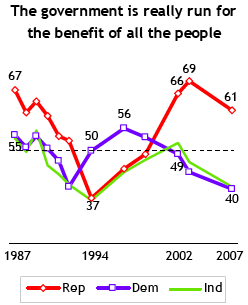
The next two charts show
how out of sync Republicans are
Notice how the one below shows how the Independents
gave us Republicans in 1994 and Democrats in 2007.
That’s what I vote
| Party | 1994 | 2002 | 2007 |
|---|---|---|---|
| Republican | 68% | 81% | 82% |
| Democrat | 70% | 71% | 70% |
| Independent | 64% | 68% | 68% |


")
